As many of you app owners have probably heard, Google has shut down their Google Analytics SDK’s for mobile apps and will delete all historical data for apps after January 31st! If you want more information on their recommended migration to Firebase, Google’s new app analytics offering, read more here.
Going, Going, Gone
If you have had an app hooked up to Google Analytics in the past, now is your last chance to try and save ALL of your data. Historical data won’t be available beyond January 31st – it will be gone forever, all of it.

Even if you don’t think you need the data moving forward, it is worth spending a little bit of time capturing big picture analytics just in case you ever need it in the future. Data is only going to be valuable when you are able to compare it. Come December 2020 and you’re analyzing your data, knowing how your app did in previous years is the only way you will be able to measure your successes and places for improvement within your app.
What to extract
In this process of exporting your data, the most important piece of the puzzle is figuring out WHAT information you need and/or want. Google Analytics has so much information, being able to drill down what you want out of the data might be the biggest decision in the entire process.
Cover the Basics
- Traffic
- When were users using your app most often? How many users did the last release or announcement bring in? Maybe you’re doing a similar announcement you did 3 years ago and you want to be able to see the traffic generated. If you don’t export anything else, export this.
- Sources of Traffic
- Where were your users coming from?
- Campaign Data
- If you’re running a campaign – think about what data you would want to look back to in the coming years.
- Conversions
- If you have conversions set up in GA, definitely download these!
The Not So Basics…
This is where a lot of decisions need to be made on what you need to know for the future… since all apps are so dynamic with completely different goals and behaviors, there’s no real guide to figuring this out generically.
Here are some questions to ask yourself and will be a great starting point to figuring out what data you want to export:
What are users doing in your app?
- Screenviews
- Screenviews could be a very helpful indicator of how people are using the app!
- If there are a few screens that are more important than others and you want more specific information on them, download data on specific screens!
- Crash Histories
- When and why was your app crashing? Remember to take advantage of the notes section when exporting for any reminders you think you might want in the future.
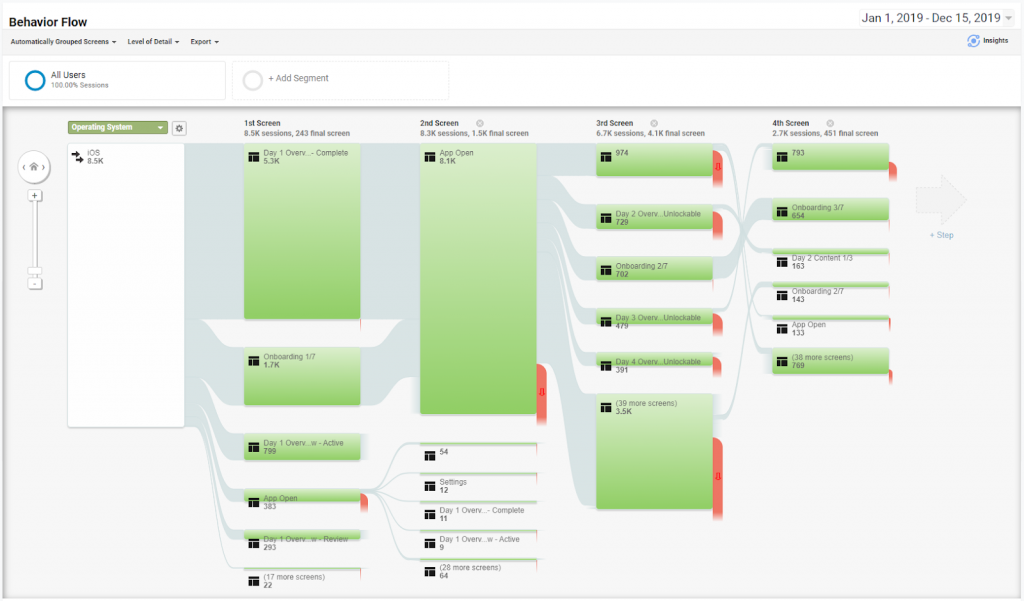
- Behavior Flows
- By going to behavior > behavior flow – this will give you an idea of the most prominent user paths in the time frame you selected! This will not be an exported excel doc, it will just be a PDF! This will be great to see quarter over quarter trends to make improvements in the UX moving forward.
- Do you have events set up?
- If so, export export, export!
- Audience Information
- New vs. Returning users (time frames will matter here)
- Session durations
- Loyalty
- Countries
- Operating systems
- Devices
- Language
Time Frames
Let’s talk numbers and time frames… Google limits you to downloading 50,000 rows per export – so depending on the amount of data, users, and activity within your app will depend on how intricate this process gets.
Apps with a lot of traffic might have to run week by week exports on all data since you’ll probably be hitting the row limit. If that’s the case for you, don’t go farther than a year back! As long as you have something to compare 2020 with, moving forward all of your data should be in the same place.
Your app might be 7 years old…going through 7 years could be a time consuming project. Our recommendation is to go back one year in quarterly chunks (if you’re not hitting the row limit before that). If you have some extra time, grabbing the whole year as an export is a good option as well to be able to use for a yearly comparison!
For example, if your app stopped collecting data in October 2019, start with collecting the last quarter of 2018. See below.
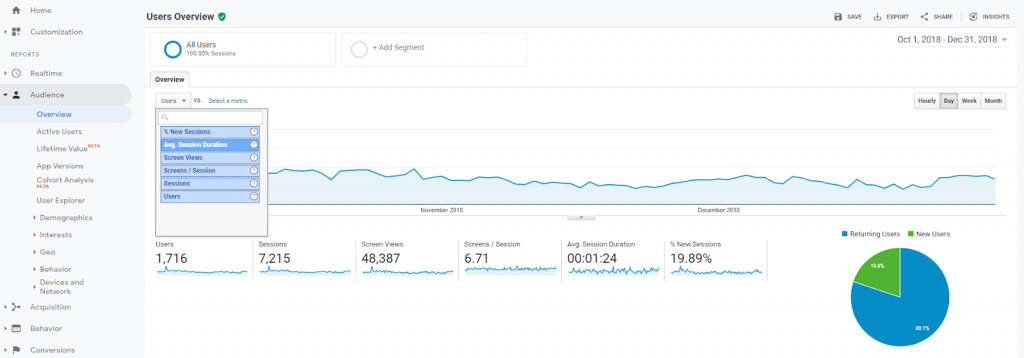
From this screen we can see we are exporting the amount of users from October 1, 2018 to Dec 31, 2018. Once we click export to excel, this is what the data set looks like:
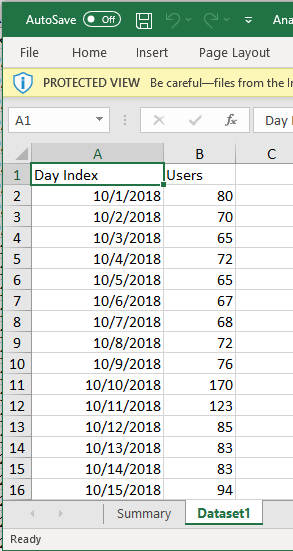
Now, you can start using this spreadsheet for all of Q4. Renaming and moving over datasets will make all of your Q4 data easy to find in one spreadsheet!
Organization is key in making this data useful in the future.

Remember, you will have to export each data set for each quarter.
How to Export
Exporting will be the easiest portion of this process! Once you figure out your time frames and what information you want – this part just might be time consuming!
- Set your time frames
- Go to the data you’re wanting
- Click export..
Before you do this repeatedly…. Lets take a look at the data you accumulated. Analyzing data in an excel spreadsheet is a different ballgame for some of us.
It might be extremely helpful to add notes/change labels to what makes the most sense for your team to each spreadsheet. The data is very raw and basic so making sure you can actually find the data as well as understand it is probably the most important piece of this process…
Grouping Data
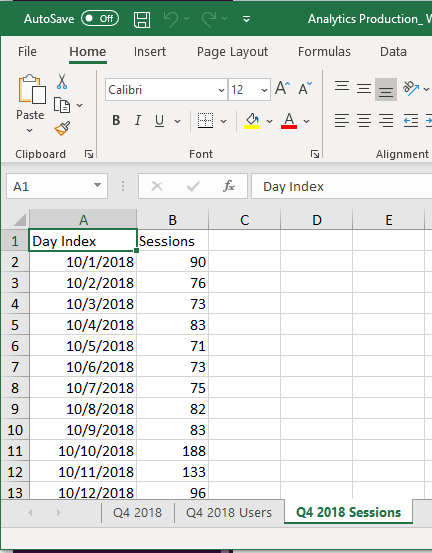
If you are having to group data due to row limitations or you’re just want your data broken up monthly or yearly – grouping this data into sheets will be extremely helpful!
Below we’ve grouped by Quarters to make future comparisons fast and easy.
Time = Value
The time you invest in downloading this data is only as valuable as your use of it in the future. App data reveals user behavior trends, defines the success of the app and proves the value the mobile app is delivering for your business.
Taking the time now to pull this data will support strategic decisions on when to invest in changes to the app and where.